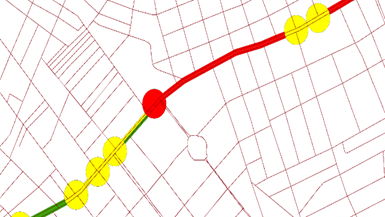
The aim of this research is to conduct a spatial analysis of driver safety behavior using data from smartphones. More specifically, it is investigated how the number of harsh accelerations and decelerations per day, which are key elements of everyday driving, is influenced with both the road environment and road users’ behaviour. Data were processed in a GIS computer software, resulting to the creation of new tables describing the phenomena observed on the signalized arterial studied (Leoforos Mesogeion) in node and link areas. Additionally, analytic maps were developed that aimed to indicate patterns of the accumulation and ranking of the harsh events in the selected road segments. Finally, four linear regression models were developed, which demonstrated speed as the most statistically significant factor in predicting the number of harsh events per day on a region basis.
| ID | pc379 |
| Presentation | |
| Full Text | |
| Tags | big data, driver behaviour, junctions, naturalistic driving, road infrastructure, statistical modelling, telematics, traffic management |